onboarding design

Project overview

Empowering managers

  • New product
  • User research
  • Design sprint
  • Desktop
  • Mobile web

Problem: Clarifi dashboard was designed for general and regional restaurant managers. However, the beta experience wasn't performing well. After talking to pilot users, we realized that the existing design wasn't very useful as it didn't address the unique ways each restaurant managed its business.

Solution: We’ve created a customizable dashboard that allows managers to access important information in one place, on-the-go or from their office computer. They were able to customize what data was shown and how it’s calculated.

Outcome: "It’s very helpful to see all information I need in one place and be able to access it on the go."

More on Process More on Final Design

Dashboard Discovery Flow

enteprise software design

Research Insights

While interviewing ten managers, we’ve learned that every restaurant has its own unique way of measuring a successful shift. We’ve also learned that managers have to go through a lot of friction to access the data they need. A lot of times that data is available too late.

Design Sprint

During a design sprint, we’ve explored the idea of a customizable KPI tile dashboard as a way to address the unique needs of our users. We've also worked on simplifying the process of driving the users to the "discovery stage" of the dashboard experience.

Testing the Design

User test showed that managers were excited about the idea of a customizable dashboard. We've also learned that regional and store managers have different needs when it comes to KPIs. The difference in experiences needed to be more explicit.

Jobs to Be Done

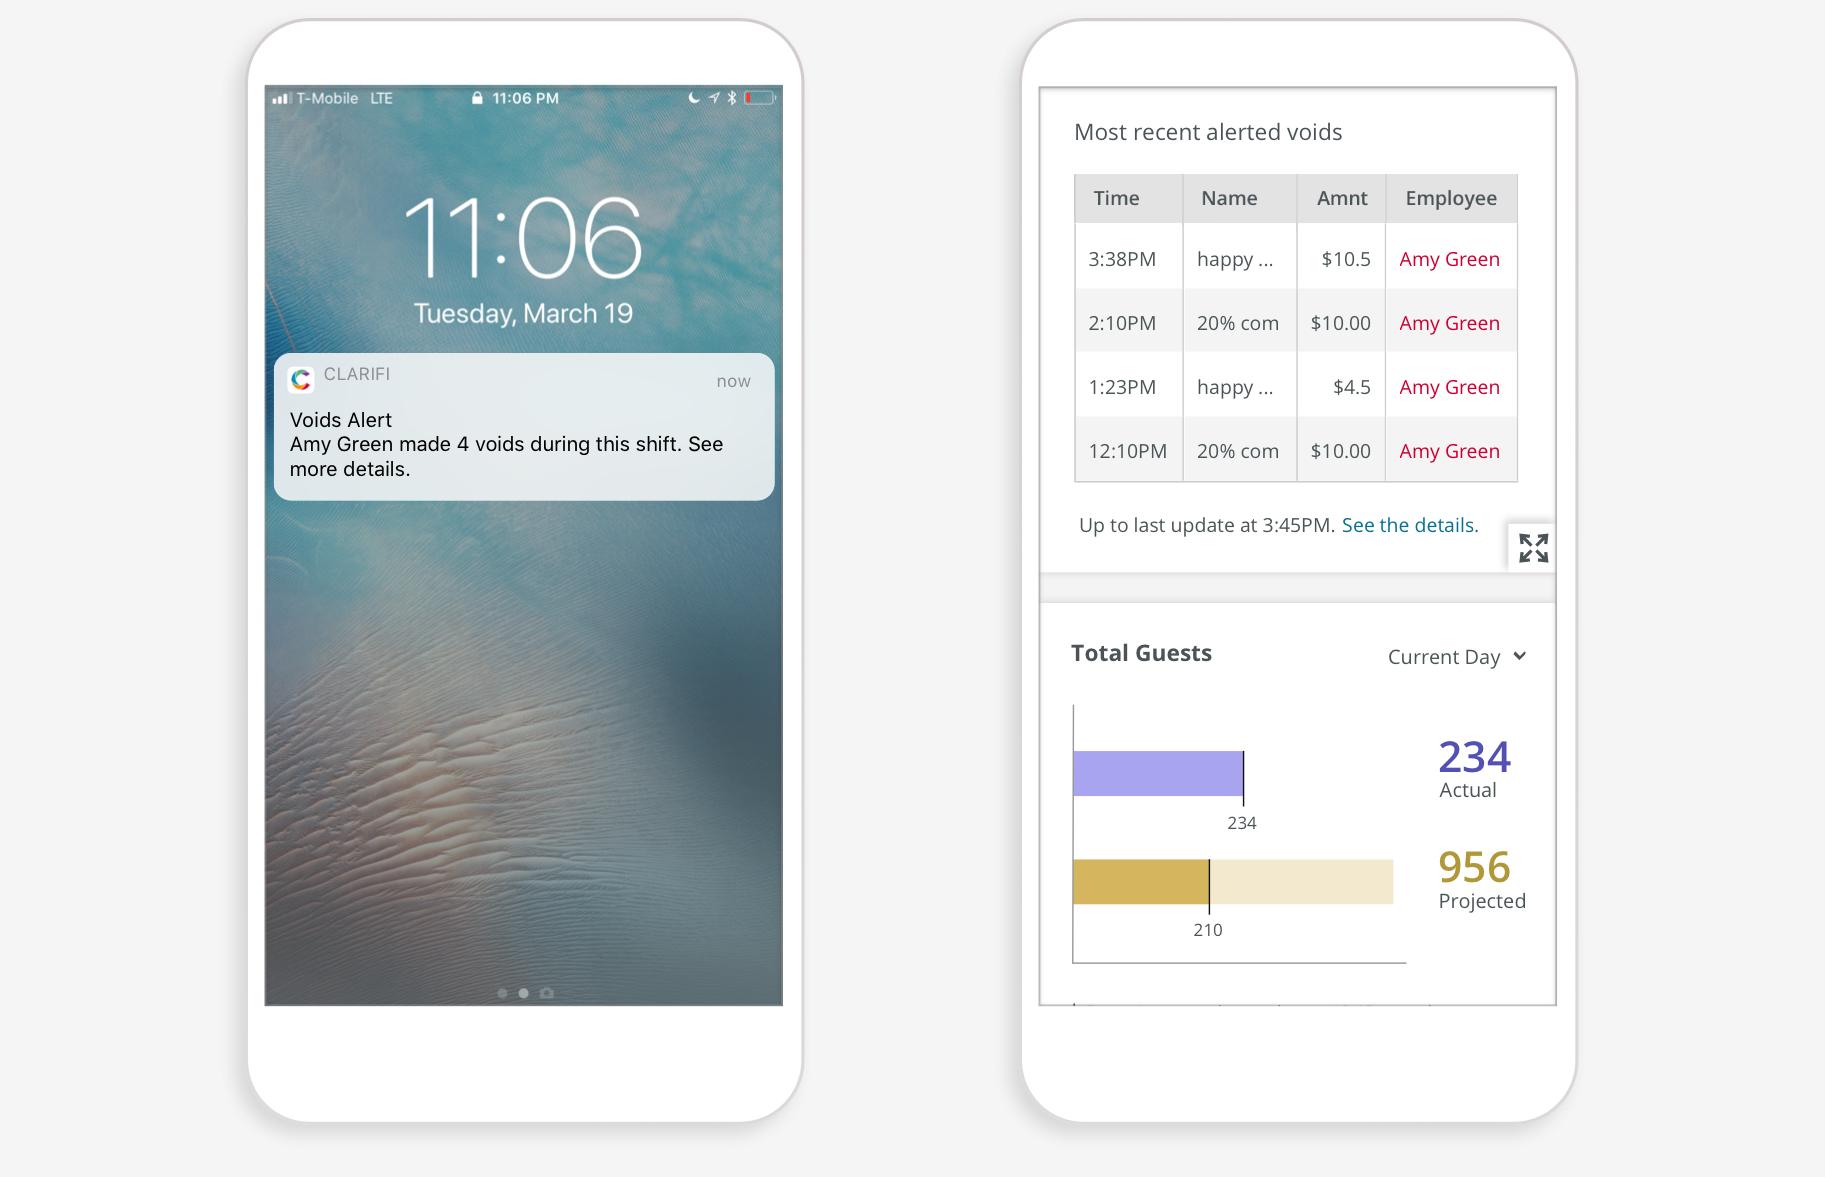
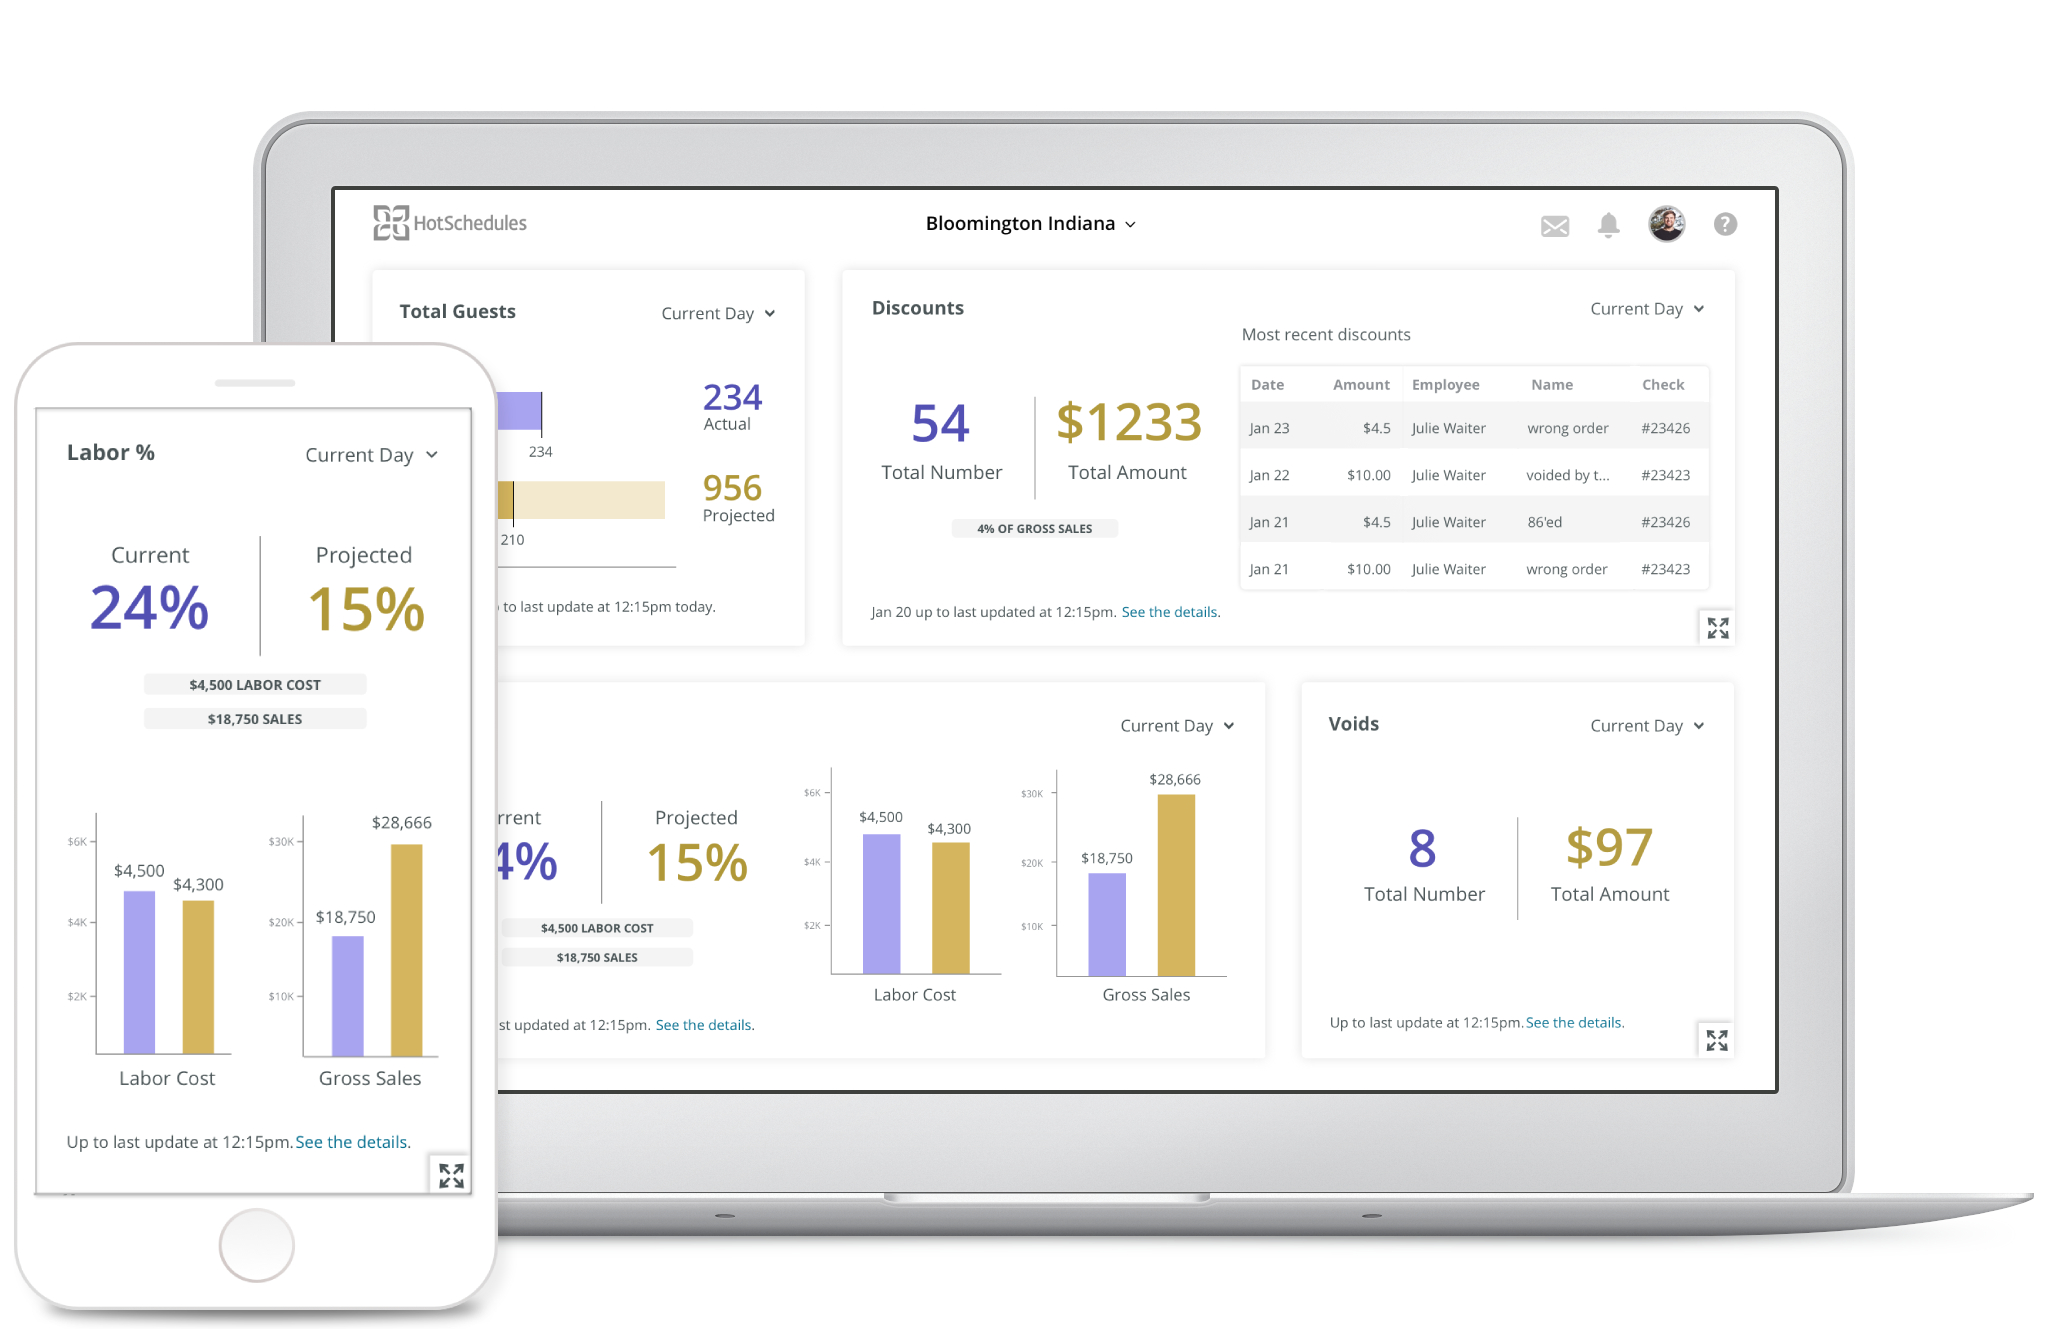
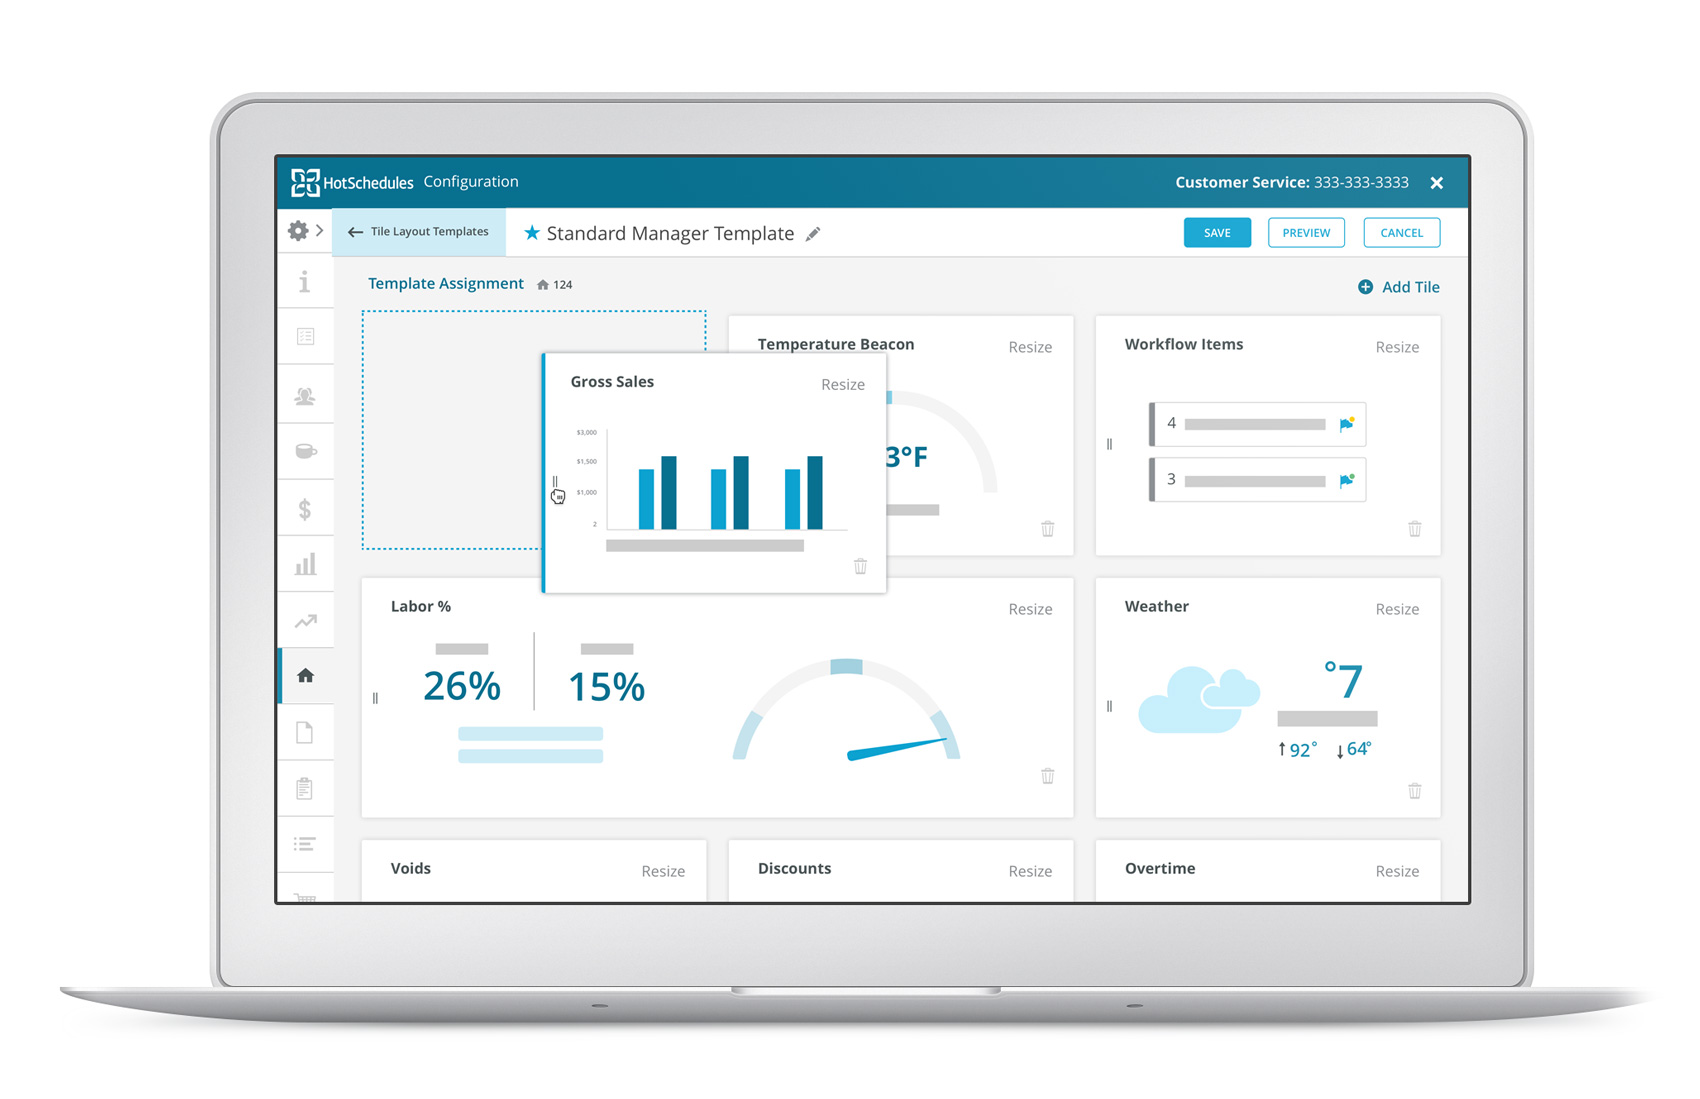
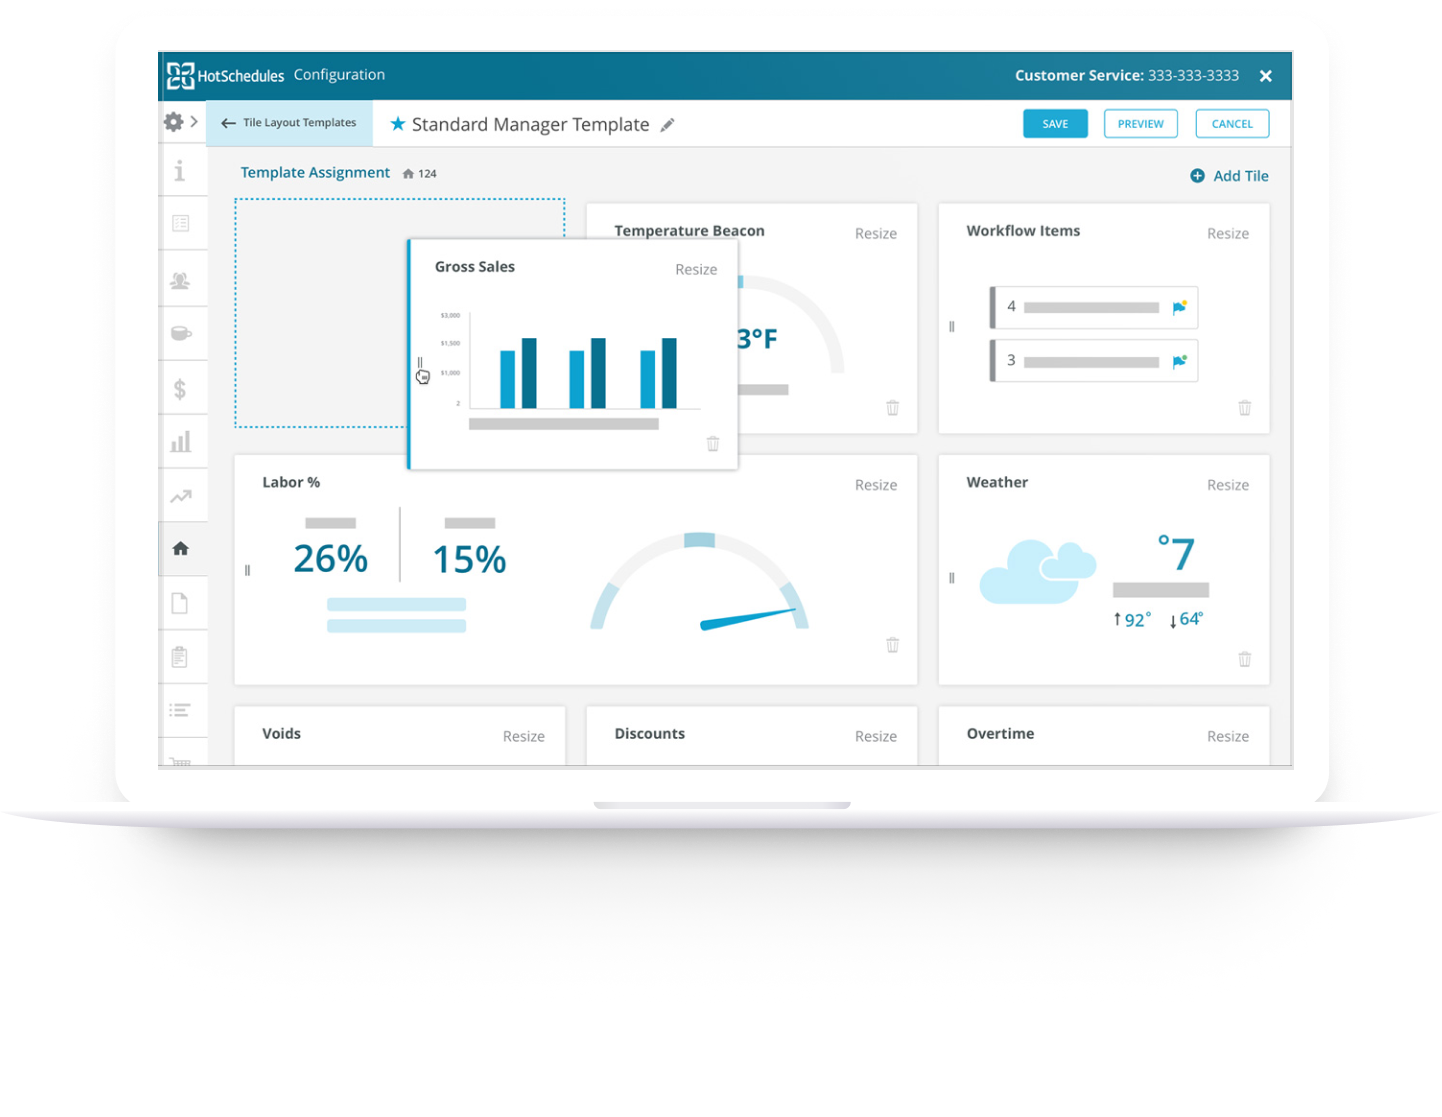
As a store manager, when I’m rushed in the middle of the store shift, I want to see how I’m performing against important metrics so I can run a profitable business.

As Regional Manager, when I’m on the run during my workday, I want to be able to see how my locations are performing against important metrics so I can run a profitable business.

Defining tasks

enteprise software design

Store manager tasks

  • Learn about new customizable dashboard
  • Check out new standard store and above store dashboards
  • Customize above store and store templates
  • Set up goals for each store
  • Set up alerts for themselves
enteprise software design

Regional manager taks

  • Learn about new customizable dashboard
  • Check out new standard store dashboard
  • Receive and get to know their goals
  • Set up alerts for themselves

Addressing Different Needs

We've validated that the ability to create a unique dashboard experience was valuable to users. Since regional and store managers had different KPI tile needs, I've introduced two categories of templates: store and above store (industry term for regional managers). Each would have its own set of tiles to choose from, creating valuable dashboard experience for both user types.

enteprise software design
  • Refresh the page if the video isn't playing

  • ux design whiteboarding

Drag And Drop Interaction

Inside templates, users can rearrange the tiles within a flexible grid. Here are different stages of that interaction:

      Regular state: a commonly used icon signifies the ability to rearrange.
      Hover state: The preview image fades back. Re-size and delete icons become more visually prominent. The pointer cursor appears on hover over the left side indicating that the tile can be grabbed.
      Active State: Grab cursor and stronger drop shadow appears. The drop area is indicated with a dotted line.

The tile framework is responsive. The layout adjusts to the device width providing the ultimate experience.

Driving Users to The Dashboard

While working on the design, we've considered how we will drive users to utilize the new dashboard. Since 78% of the managers have the native HotSchedules app downloaded, we decided to use it as a way to deliver push notifications to the user. The user would have the flexibility to set custom thresholds for notifications. Eventually, using the dashboard will become a habit and internal triggers, such as mild pressure to make the staffing decision, will cause the user to use the app.

enteprise software design

Finalized Design

  • desktop application
  • desktop application

Measurable Outcomes

Since Clarifi is a new product on the market, we used user acquisition and retention as a metric to measure the success of the dashboard redesign.